Blog › AI
After ChatGPT: What YC Companies Are Building, and What the Outcomes Show
A breakdown of 2,532 YC companies shows where B2B and industrial activity expanded. Valuation research reveals stronger outliers, with a similar median.
What changed in YC’s company mix, and what would make those products economically useful? The directory shows where founders are building. Assessing their value requires separate evidence about customer outcomes and operating costs.
The sector analysis covers 2,532 publicly listed YC companies from the 2023–2026 batches, captured on 5 November 2026. The 2026 figures are a snapshot through that date, not a completed-year total. All cross-cohort industry percentages use current directory classifications. They measure how YC’s directory labels past batches today, not necessarily the sectors those companies were originally pitched or funded under. This is a comparison of listed cohorts, not a verified history of YC’s investment decisions; establishing that history would require archived descriptions and classifications from each batch. The valuation research has different coverage and methods; its figures are presented separately.
How to read the categories: “Industrials” includes manufacturing and robotics, aviation and space, energy, defense, drones, climate, agriculture and automotive businesses. It is not a pure robotics or hardware category. An industrial company can also sell to businesses. Here, B2B and Industrials are directory labels: each company is counted once under its first listed primary category. That accounting choice prevents double-counting; it does not make their customers or business models mutually exclusive.
Three findings frame this analysis:
- Industrial activity expanded in both count and share. Industrials rose from 12 of 494 listed companies in 2023 (2.4%) to 162 of 827 in 2026 (19.6%). Manufacturing and Robotics is the largest named industrial subcategory across the four years.
- B2B infrastructure gained ground within a larger cohort. It rose from 39 of 621 companies in 2025 (6.3%) to 86 of 827 in 2026 (10.4%). Within Infrastructure, execution and reliability grew strongly in count, but their combined share changed more modestly.
- Higher average valuations do not establish broad improvement. A separate September 2026 re-run reports means of $48.2m for pre-2023 batches and $85.8m for recent batches, but medians of $5.1m and $5.2m. Removing the top 10 companies from each group leaves both means at $22.4m.
ChatGPT launched publicly on 30 November 2022. That date provides context, not evidence that every later YC company uses AI or that AI caused these changes.
Read the industry changes, infrastructure drilldown, or separate valuation evidence.
The portfolio broadened into industrial markets
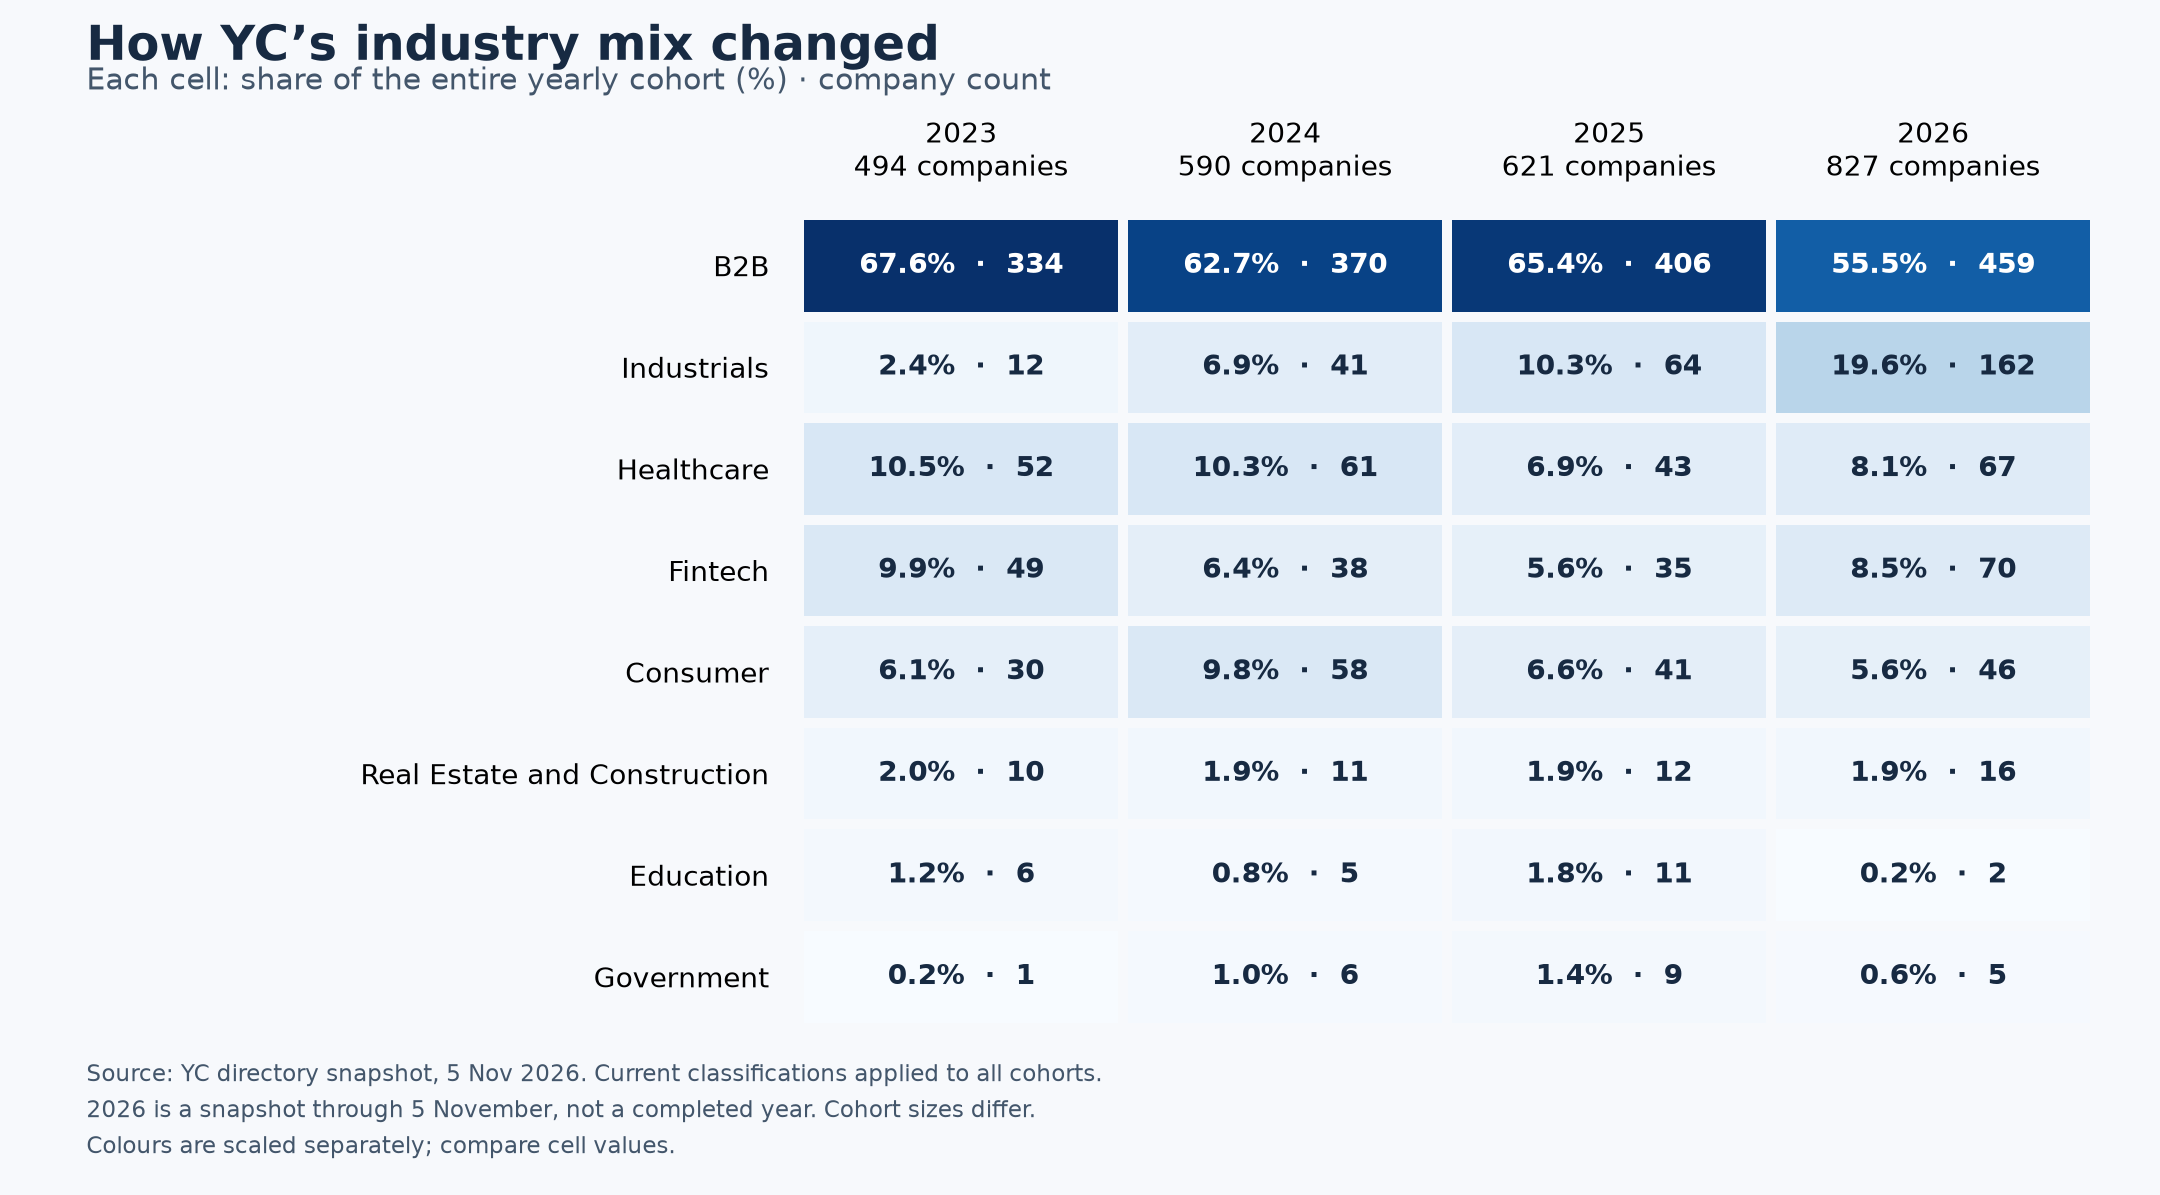
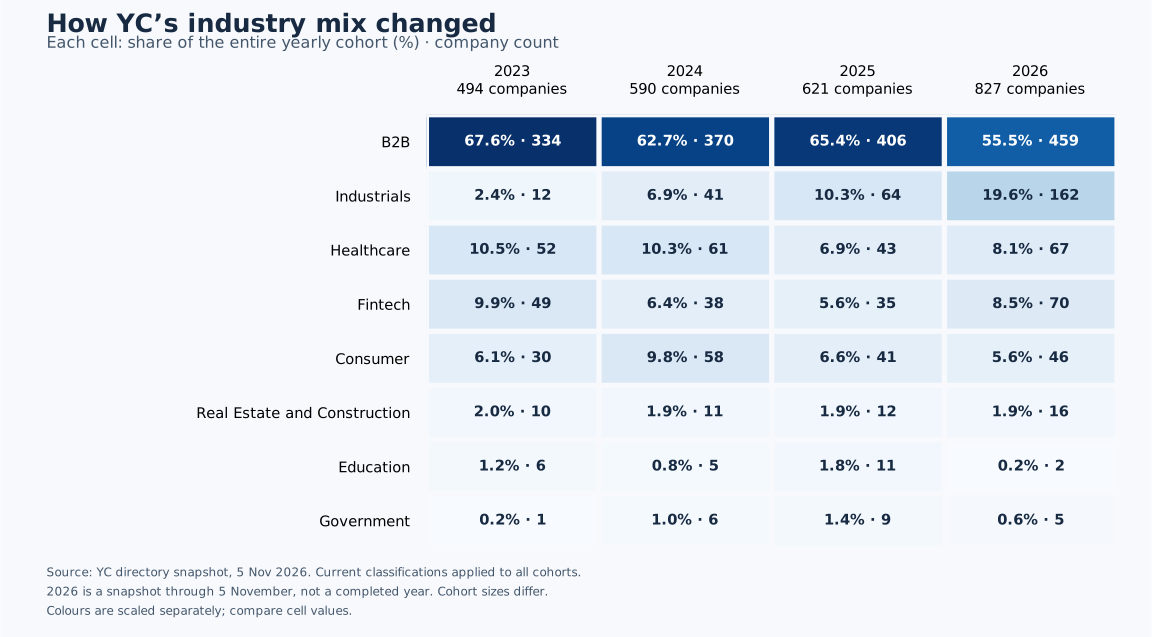
Using one current directory classification across all cohorts, Industrials rose from 12 of 494 companies in 2023 (2.4%) to 162 of 827 in 2026 (19.6%). Its share grew roughly eightfold. The category is not synonymous with AI.
A falling share does not necessarily mean retreat. B2B’s share declined from 67.6% to 55.5%, but its count increased from 334 to 459. Fintech also recovered: its count doubled from 35 in 2025 to 70 in 2026, while its share rose from 5.6% to 8.5%. The data supports a broader company mix, rather than a simple abandonment of software or fintech.
Inside B2B: what businesses are actually being built?
Infrastructure increased from 39 companies in 2025 to 86 in the 2026 snapshot. Counts rose 120.5%, while the entire cohort grew 33.2%, from 621 to 827. Infrastructure’s share of the entire cohort rose from 6.3% to 10.4%, a 4.1 percentage-point increase. This is evidence of a composition change as well as a larger cohort.
Coverage gap: 152 of 459 B2B companies in 2026 (33.1%) have no listed subcategory, compared with 85 of 334 (25.4%) in 2023. The chart retains these companies. Named subcategories therefore describe only part of B2B, and changing classification coverage can affect the comparison.
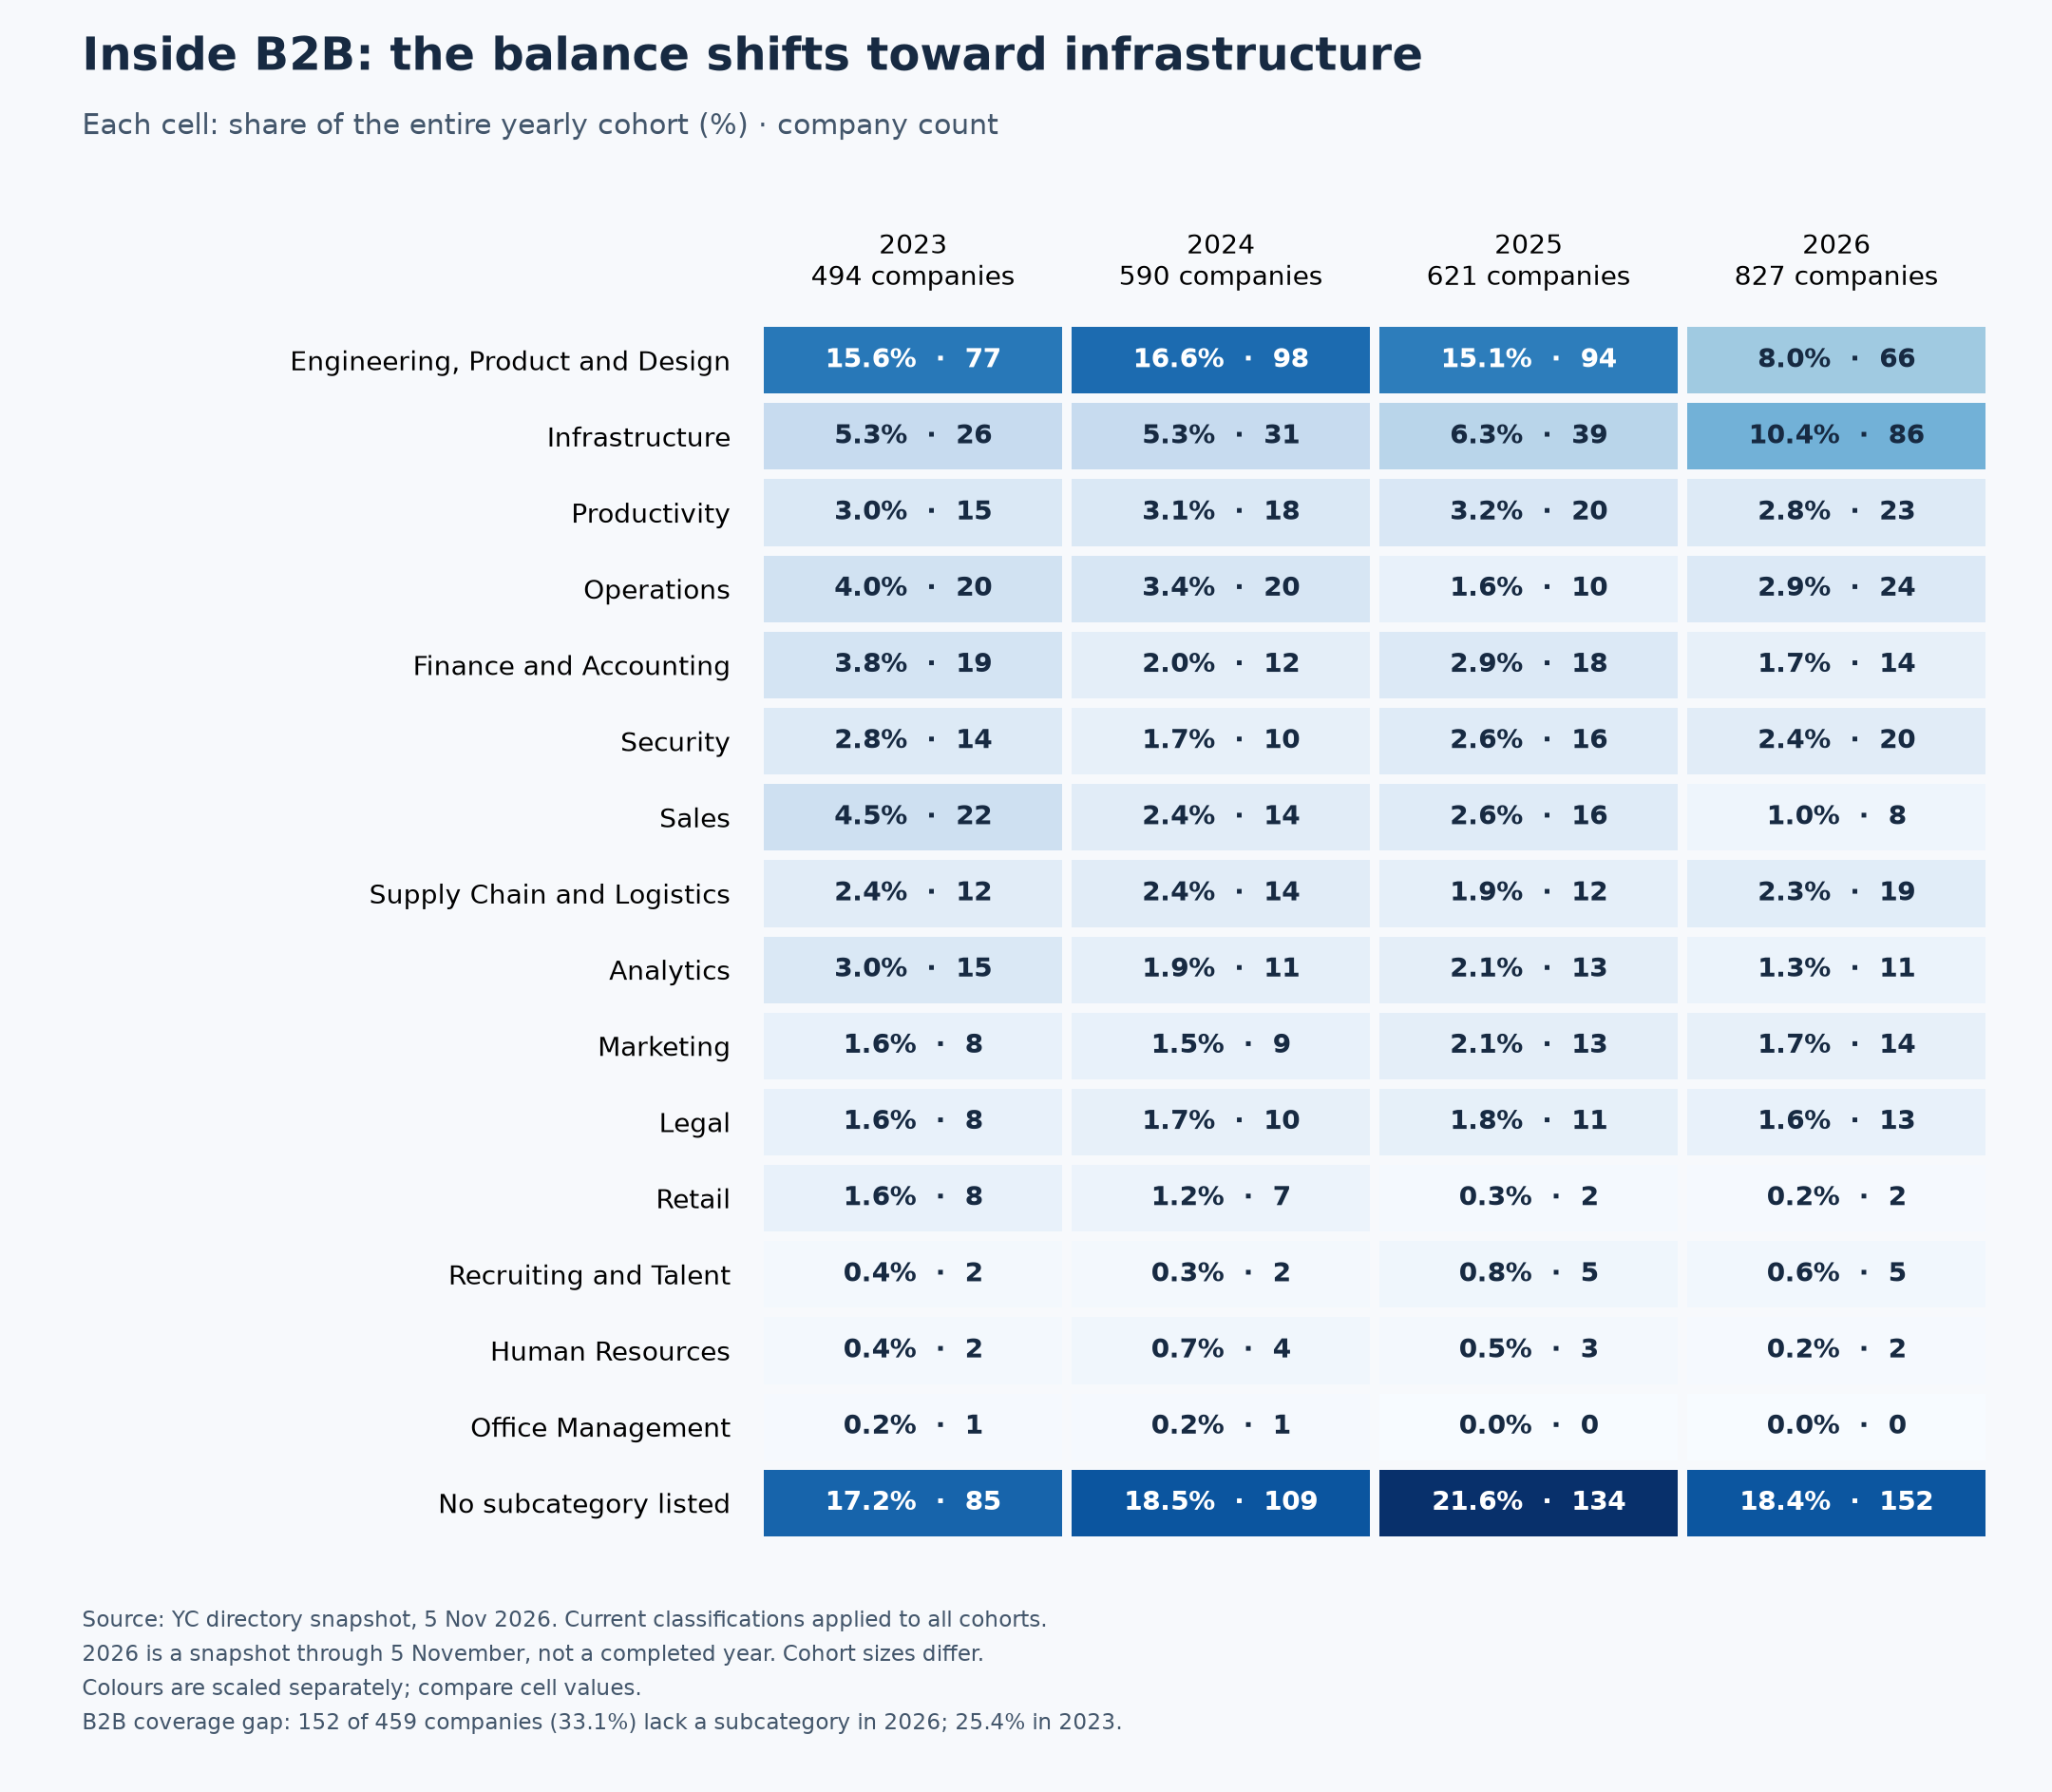
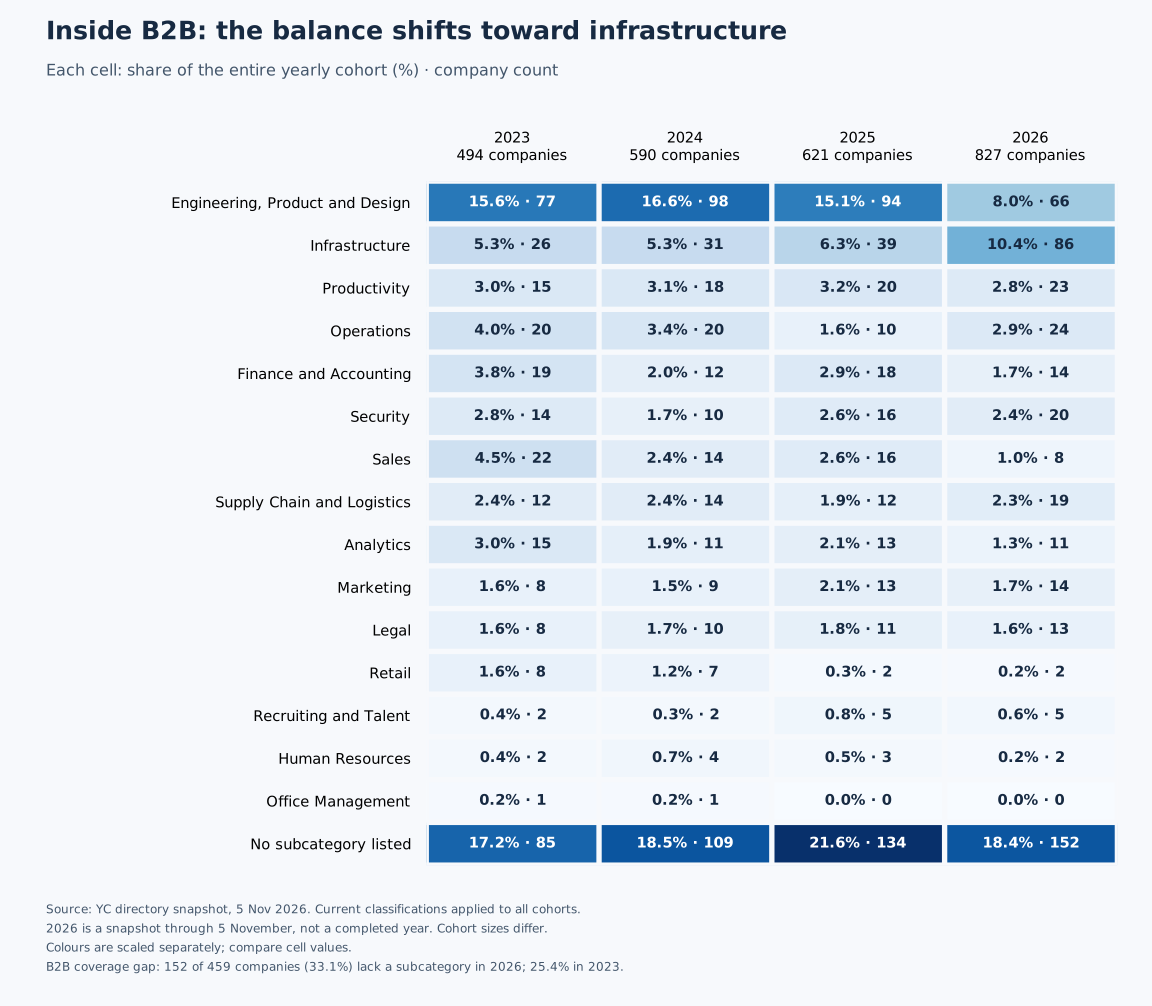
B2B accounts for 1,569 companies across the four cohort years. The table uses YC’s listed subcategories. Every percentage uses the full B2B total, including the 480 companies with no listed subcategory. The named rows therefore provide an incomplete breakdown, not percentages recalculated over only classified companies. The descriptions explain their scope; they are not additional classifications assigned to individual companies.
| Subcategory | Companies | Share of B2B | What it covers |
|---|---|---|---|
| Engineering, Product and Design | 335 | 21.4% | Tools for building software and designing products |
| Infrastructure | 182 | 11.6% | Systems and services supporting applications, data and AI workloads |
| Productivity | 76 | 4.8% | Tools for everyday knowledge work and collaboration |
| Operations | 74 | 4.7% | Tools for running business workflows and service processes |
| Finance and Accounting | 63 | 4.0% | Accounting, tax and financial workflows |
| Security | 60 | 3.8% | Protection of applications, systems and data |
| Sales | 60 | 3.8% | Tools for sales teams and customer acquisition |
| Supply Chain and Logistics | 57 | 3.6% | Shipping, warehousing and supply-chain coordination |
| Analytics | 50 | 3.2% | Data analysis, shared metrics and business intelligence |
| Marketing | 44 | 2.8% | Advertising, campaigns and audience development |
| Legal | 42 | 2.7% | Legal research, document and case workflows |
| Retail | 19 | 1.2% | Tools for retailers and commerce operators |
| Recruiting and Talent | 14 | 0.9% | Hiring and talent sourcing |
| Human Resources | 11 | 0.7% | Workforce administration and employee processes |
| Office Management | 2 | 0.1% | Workplace and office administration |
| No subcategory listed | 480 | 30.6% | The directory supplies only the broad category |
Engineering, Product and Design is the largest named B2B subcategory, followed by Infrastructure. These are different from selling an application to an accounting, legal or sales team: they often provide the tools and systems used to build or operate other products.
For a concrete example of Analytics, Honeydew describes its product as a home for shared data logic. That is a specific data-management problem within the much broader B2B label. Named examples throughout this article illustrate product directions; they are not a representative sample of a batch and do not establish typical commercial performance.
Nearly a third of B2B companies, 480 of 1,569, have no listed subcategory. They remain in the total and are shown separately. Assigning them to sectors from names or a few tags would introduce a different, subjective classification method.
Inside Industrials: manufacturing, energy, defense and more
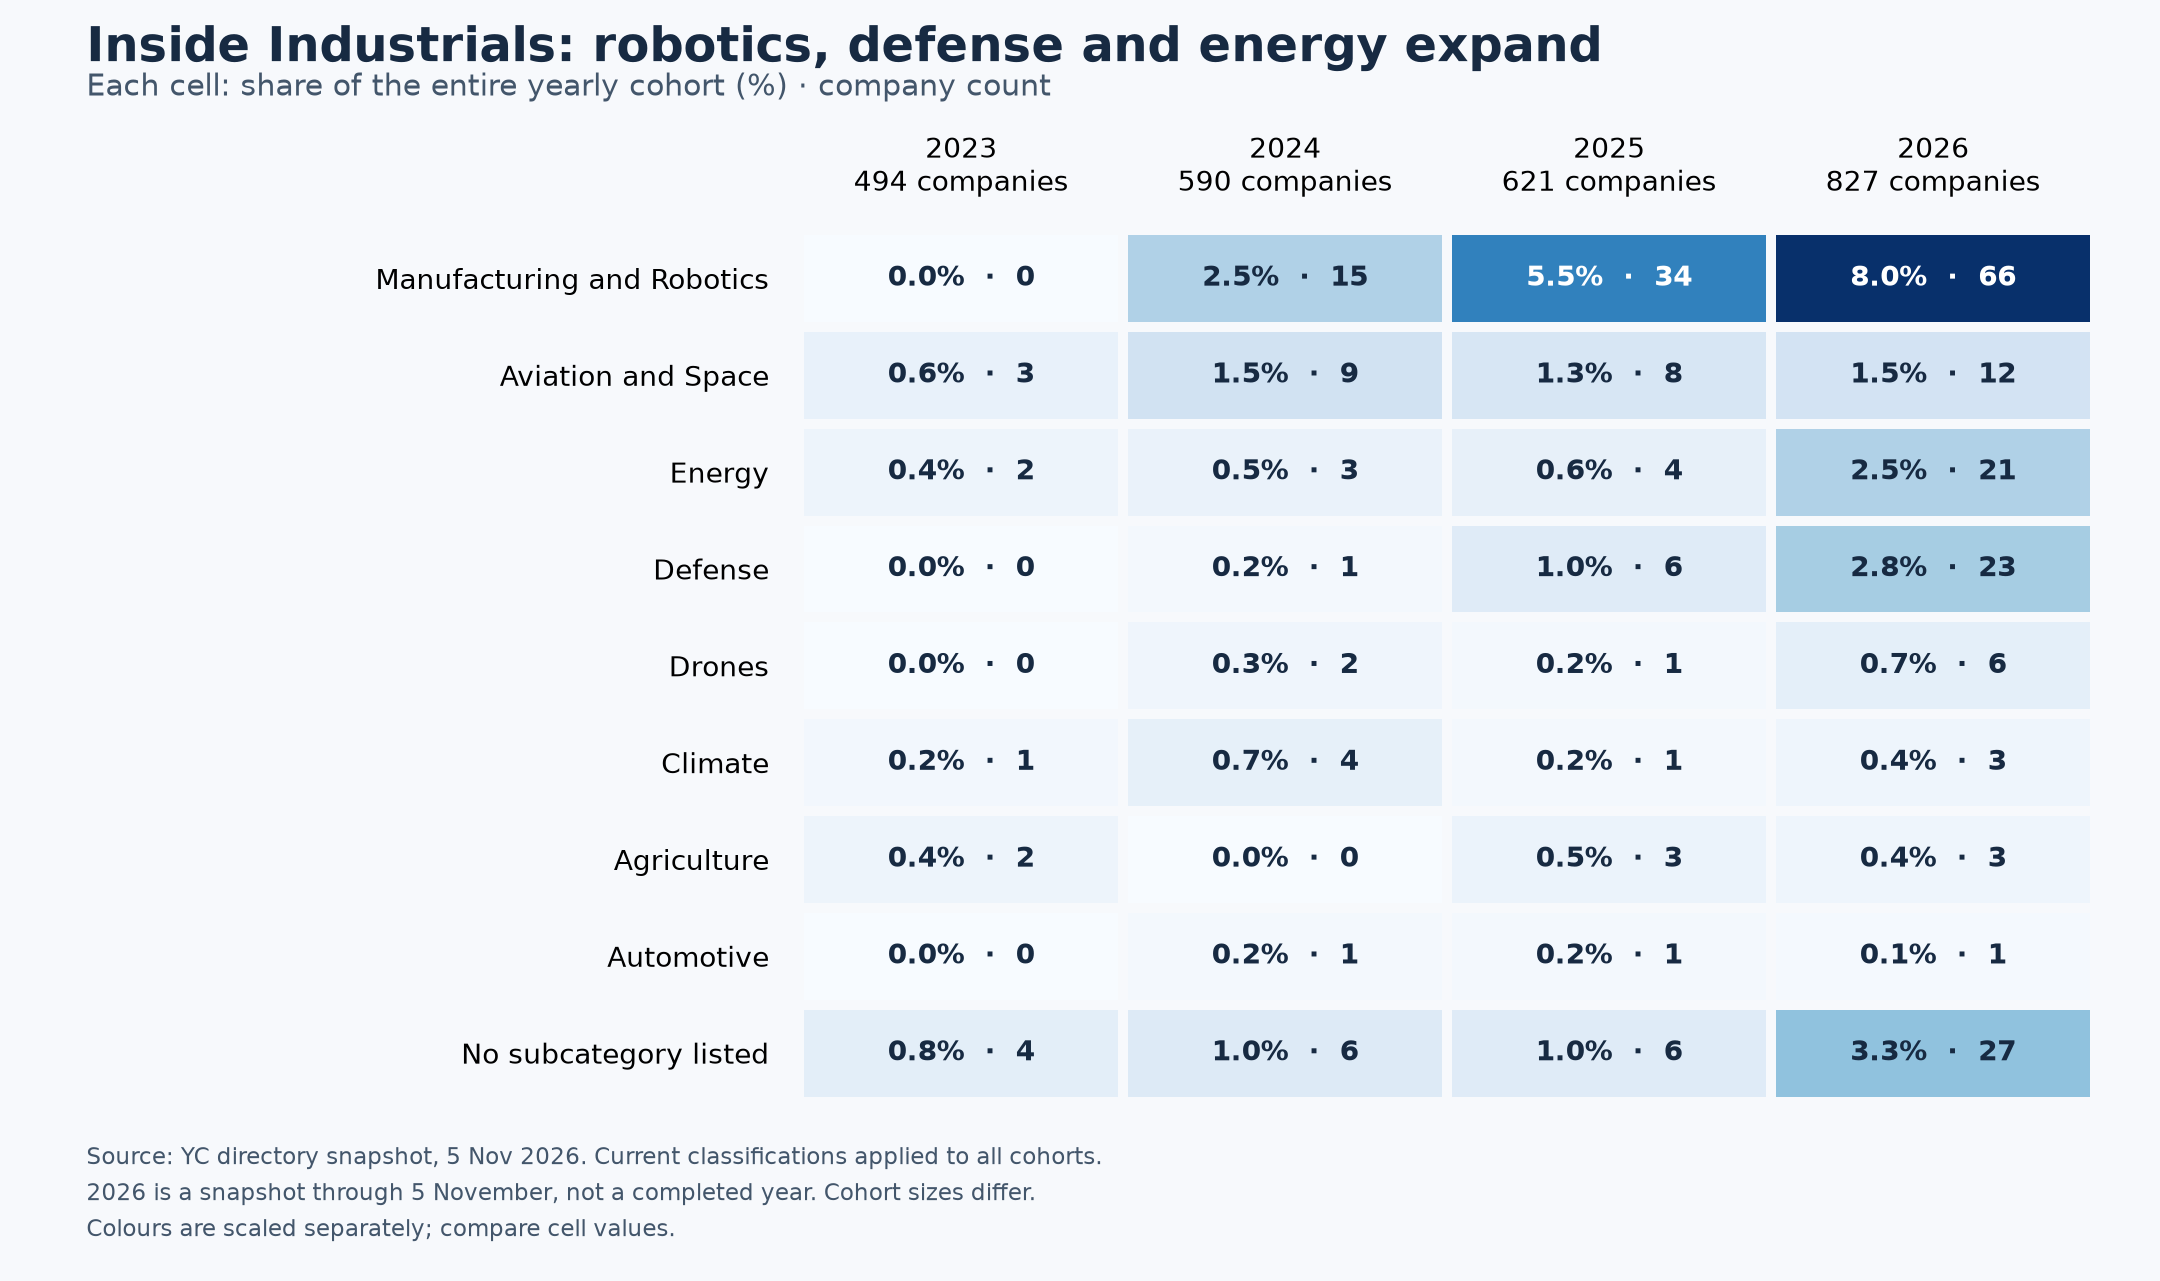
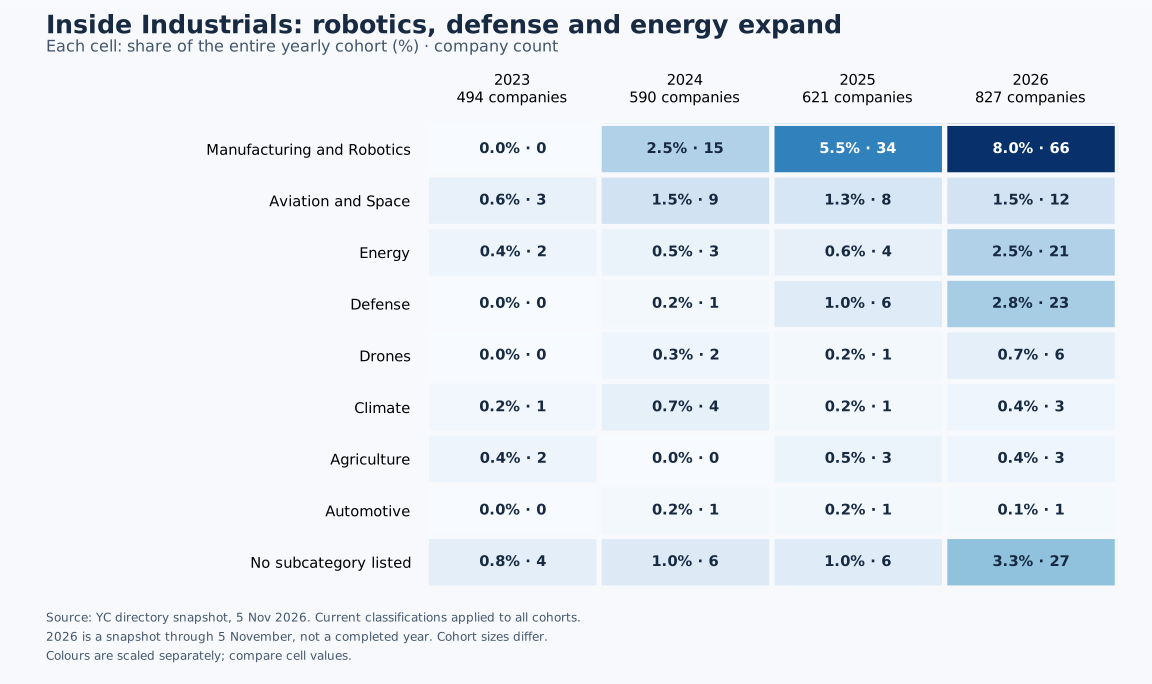
Industrials accounts for 279 companies. Every percentage below uses that full total, including the 43 companies with no listed subcategory. Manufacturing and Robotics makes up 41.2% of this group, but the category also includes aerospace, energy, defense, agriculture and other applications.
| Subcategory | Companies | Share of Industrials | What it covers |
|---|---|---|---|
| Manufacturing and Robotics | 115 | 41.2% | Production, quality inspection, robots and automation |
| Aviation and Space | 32 | 11.5% | Aircraft, aerospace and space systems |
| Energy | 30 | 10.8% | Power, batteries and energy-system tools |
| Defense | 30 | 10.8% | Products serving defense applications |
| Drones | 9 | 3.2% | Uncrewed aircraft and supporting systems |
| Climate | 9 | 3.2% | Climate-related technologies and infrastructure |
| Agriculture | 8 | 2.9% | Farming technologies and agricultural inputs |
| Automotive | 3 | 1.1% | Vehicle and automotive-business technologies |
| No subcategory listed | 43 | 15.4% | The directory supplies only the broad category |
Bucket Robotics works on manufacturing defect detection using CAD and synthetic data. Ionworks provides simulation software used by battery and automotive companies. These examples show why “Industrials” should not be read as “companies that manufacture hardware.” Software can serve an industrial customer or process.
B2B and Industrials are directory categories, not mutually exclusive business models. An industrial company can sell to other businesses. For these calculations, each company is counted once under its first listed primary category.
Which subcategories changed most?
To compare portfolio composition, the table below shows both company counts and the percentage of the entire cohort. The denominator is 494 listed companies in 2023 and 827 in 2026. These selected categories illustrate the shift; the downloadable table includes every subcategory and all four years.
| Subcategory | 2023 count | Share of 2023 cohort | 2026 count | Share of 2026 cohort |
|---|---|---|---|---|
| B2B: Infrastructure | 26 | 5.3% | 86 | 10.4% |
| B2B: Engineering, Product and Design | 77 | 15.6% | 66 | 8.0% |
| Industrials: Manufacturing and Robotics | 0 | 0.0% | 66 | 8.0% |
| Industrials: Energy | 2 | 0.4% | 21 | 2.5% |
| Industrials: Defense | 0 | 0.0% | 23 | 2.8% |
Infrastructure expanded in both count and cohort share. Engineering, Product and Design declined on both measures between these endpoints. Within Industrials, Manufacturing and Robotics is the largest contributor to the increase in company count, with Energy and Defense also contributing.
A zero means no company in that cohort carries that subcategory in this snapshot. It does not establish that YC had no exposure to the underlying technology. Classifications can change, and older companies may be reclassified or absent from the directory. These are portfolio-composition comparisons, not evidence that one sector generates better returns.
Download the complete subcategory breakdown for 2023–2026 (CSV).
What Infrastructure companies actually build
Infrastructure is a broad directory label. To inspect it more closely, we reviewed the snapshot descriptions of all 182 companies in B2B → Infrastructure and assigned each to one primary function. This is an author-created taxonomy, not an additional YC classification. Products can span several functions; each company appears once so the counts add up. Descriptions reflect the 5 November snapshot, including for older cohorts.
The distinction matters: this category includes agent runtimes, databases, model-serving systems, payment tools and specialized applications. It cannot be treated as a count of AI-agent infrastructure alone.
The functional mix, year by year
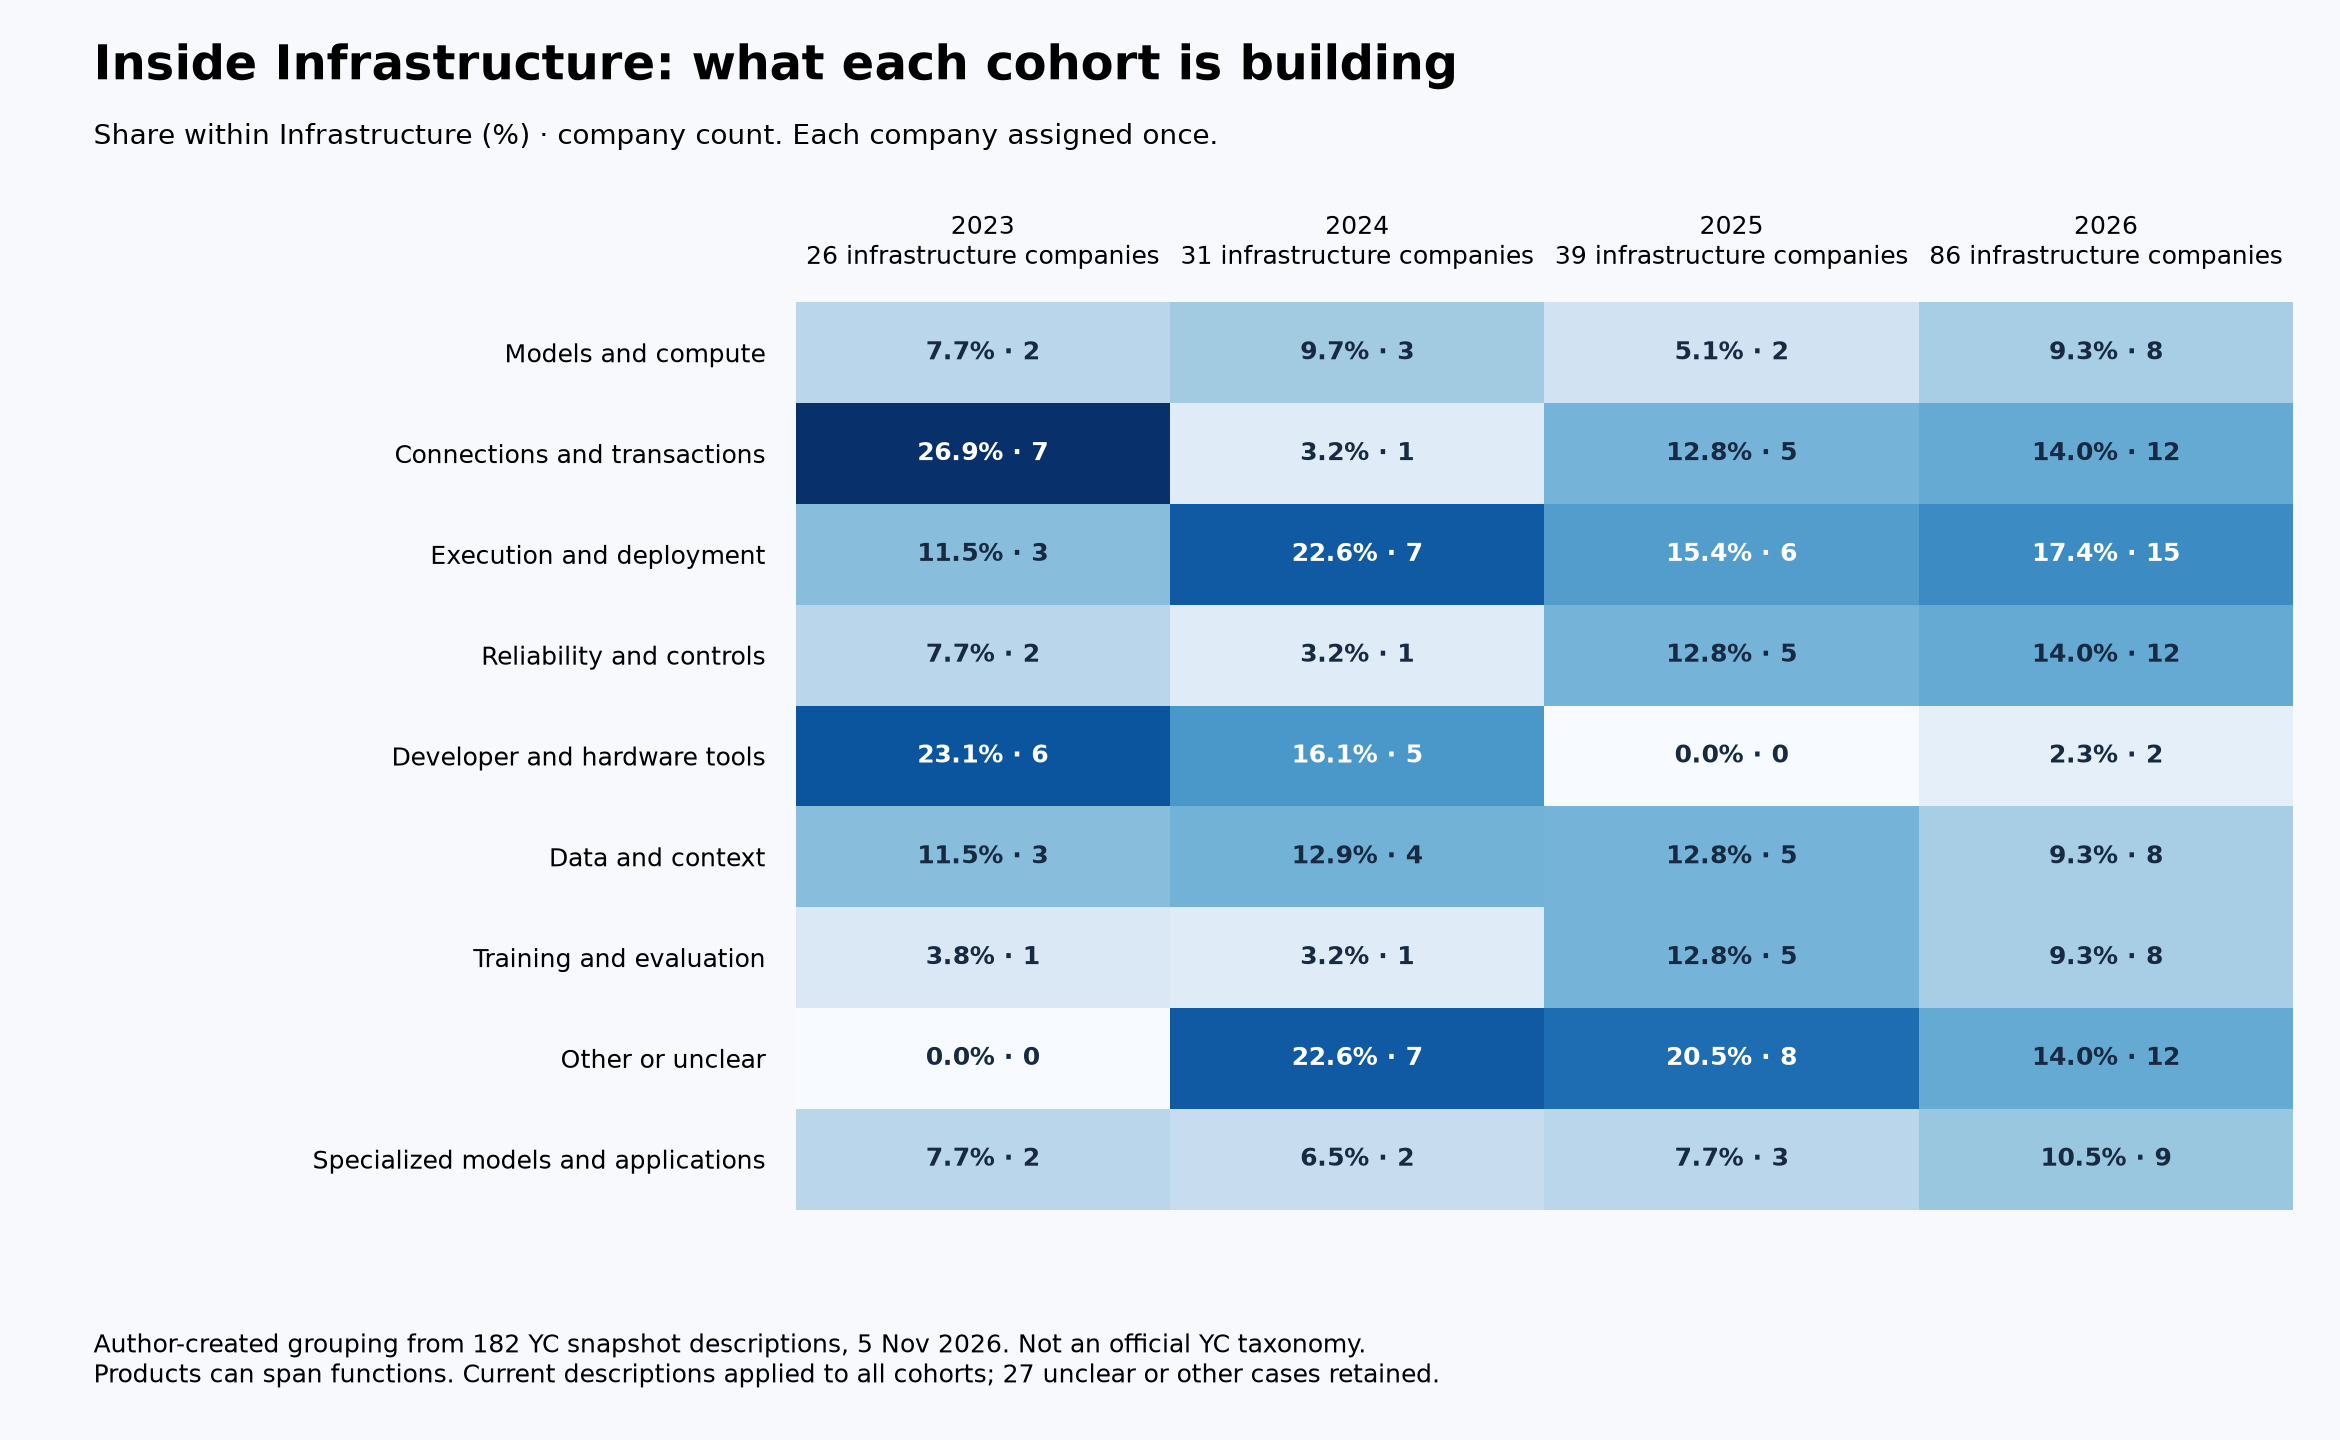
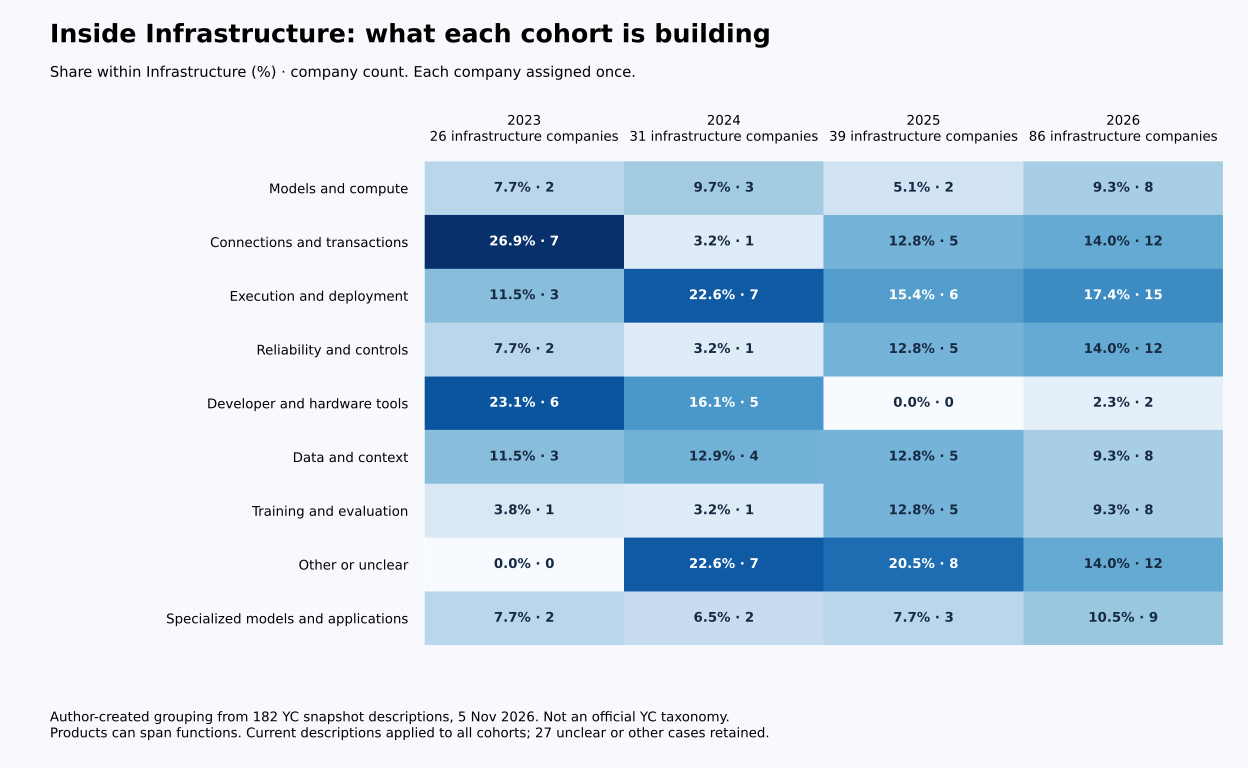
Each cell below is a company count. The denominator is the Infrastructure group for that year, not all B2B companies or the entire cohort.
| Primary function | 2023 | 2024 | 2025 | 2026 |
|---|---|---|---|---|
| Execution and deployment | 3 | 7 | 6 | 15 |
| Models and compute | 2 | 3 | 2 | 8 |
| Data and context | 3 | 4 | 5 | 8 |
| Connections and transactions | 7 | 1 | 5 | 12 |
| Reliability and controls | 2 | 1 | 5 | 12 |
| Training and evaluation | 1 | 1 | 5 | 8 |
| Developer and hardware tools | 6 | 5 | 0 | 2 |
| Specialized models and applications | 2 | 2 | 3 | 9 |
| Other or unclear | 0 | 7 | 8 | 12 |
| All Infrastructure companies | 26 | 31 | 39 | 86 |
Download every company assignment and its source description (CSV). These counts describe what companies say they build. They do not measure customer spending or prove product performance.
What the functional breakdown actually tells us
Infrastructure grows from 39 companies in 2025 to 86 in 2026, a 120.5% increase. Within our author-created grouping, Execution and Deployment grows from six to 15, and Reliability and Controls from five to 12. Together they rise from 11 to 27 companies, but their share within Infrastructure moves only from 28.2% to 31.4%. The larger count is striking; the change in composition is more modest. Much of the increase accompanies growth of the whole category.
This distinction limits the technical narrative. The snapshot supports growing activity around running and controlling systems. It does not establish that these functions displaced the rest of Infrastructure. The classifications are also based on current short descriptions, not historical product specifications or independent product tests. Moving a multifunction product between groups can change these small counts.
Drill down another level: the components
| Function | More specific components | Examples from the snapshot |
|---|---|---|
| Execution and deployment | Sandboxes and agent computers; Orchestration and agent cloud; Hosting and customer deployment | Freestyle, Rivet, Cakework |
| Models and compute | Inference serving and optimization; Context and prompt compression | Texel.ai, The Token Company |
| Data and context | Search and retrieval; Memory and durable state; Databases and data movement; Extraction and web data | Trieve, Mem0, Arroyo, Indexical |
| Connections and transactions | Tool and API gateways; Agent communications and interfaces; Payments wallets and metering | SuperAPI, Inkbox, ZeroDev |
| Reliability and controls | Observability and incident response; Permissions identity and action checks | Odigos Technologies Inc., Decawork |
| Training and evaluation | Evaluations and test environments; Training data; Training optimization | Magicflow 𐂂, Markov, RunRL |
| Developer and hardware tools | Software build and development; Hardware control and configuration | Portalform, Synnax |
| Specialized models and applications | Voice models and routing; Specialized or frontier models | Speko, Guide Labs |
Who needs these components, and what would improve?
Consider a supplier-invoice workflow: retrieve the purchase order, compare it with the invoice, resolve exceptions and update an authorized record. Each infrastructure function addresses a different constraint. These are engineering interpretations and proposed measurements, not demonstrated benefits from the companies counted above.
| Function | Buyer and problem | Where efficiency could improve | What to measure against the existing process |
|---|---|---|---|
| Execution and deployment | Application teams running multi-step work that can stop midway | Resume completed work instead of restarting the entire task | Accepted completion rate, recovery time and cost per completed workflow |
| Models and compute | Platform teams facing model latency, hardware limits and inference cost | Serve equivalent-quality outputs with less compute or delay | Cost per accepted outcome and 95th-percentile latency at matched quality and workload |
| Data and context | Data and application teams working with scattered or changing records | Retrieve relevant, current evidence with less manual searching | Correct-source retrieval, stale-record errors and human correction time |
| Connections and transactions | Integration teams maintaining APIs, communications and payments | Reduce integration upkeep and repeated manual transfers | Integration effort, successful authorized operations and duplicate transaction rate |
| Reliability and controls | Operations and security teams investigating incidents or restricting actions | Detect problems sooner and prevent invalid business changes | Detection and recovery time, unauthorized changes and false blocks |
| Training and evaluation | Model and application teams deciding whether a change is safe to release | Find task failures before deployment and reduce regressions | Held-out task performance, regressions detected and failures missed in production |
| Developer and hardware tools | Developers and hardware teams configuring build or device systems | Reduce setup, build and configuration rework | Time to a working configuration, build failures and operator intervention |
| Specialized models and applications | Product teams with domain or voice requirements | Improve a specific task relative to a general-purpose alternative | Domain acceptance rate, latency, escalation rate and total operating cost |
For concrete product descriptions, Superserve describes virtual machines for long-running agents; RunAnywhere describes inference across hosted, on-premises and device environments; Salus describes validation before execution. These three examples explain proposed product roles. They do not represent the whole batch, demonstrate strong commercial traction or establish sector-wide performance.
What would establish that the infrastructure works?
The directory descriptions support the existence of these product offerings. They do not establish adoption, efficiency or commercial success. A stronger assessment would pair a named deployment with comparable before-and-after measurements: cost per successfully completed task, time to completion, error rate, recovery after interruption and unauthorized actions prevented. Those measures need a stated workload and baseline.
The practical finding is that Infrastructure contains multiple layers needed to operate software and agents, alongside specialized products that do not fit a simple agent stack. Its growing company count warrants investigation of these layers individually. It does not establish that every layer has equal demand or that the newest companies have solved the underlying problems.
CTO deployment checklist: workflow state, true operating cost and failure tests
The architecture question: who owns the workflow state?
The crucial boundary in an agent system is between a proposed action and a committed business change. A model can propose updating an invoice. The surrounding application must determine whether the user is authorized, whether the invoice version is still current, and whether an earlier attempt already performed the update.
| Boundary | Failure to examine | Engineering requirement |
|---|---|---|
| Retrieval → model | A stale record is treated as current, or a restricted record enters context | Carry source version and access context; enforce retrieval permissions |
| Model → tool | A valid-looking request targets the wrong record or exceeds the user's authority | Validate arguments and authorize the concrete resource and operation outside the model |
| Tool → retry | A timeout hides a successful write; retrying creates a duplicate | Persist an operation identifier and reconcile the result before repeating the side effect |
| Approval → execution | The record or proposed action changes after approval | Bind approval to the reviewed action and record version; recheck before commit |
| Execution → recovery | The process restarts without knowing which steps completed | Persist workflow state and distinguish proposed, attempted, confirmed and failed actions |
| Execution → investigation | Logs show a model answer but cannot explain the business change | Correlate the request, source versions, tool calls, approvals and committed result |
These are engineering requirements inferred from the workflow, not findings that any named YC company satisfies them. AWS’s discussion of safe retries and idempotent APIs explains why retrying a request needs a contract that prevents duplicate effects. OpenTelemetry’s signal model provides context for tracing activity across components. A trace supports investigation; it does not enforce authorization or guarantee a correct transaction.
This is also where product overlap becomes important. A sandbox provides an execution environment, but does not automatically supply business permissions. Memory retains information, but does not establish that it is current. An evaluation measures selected behavior, but does not replace runtime checks. Buyers should identify the component that owns each requirement and test the boundaries between products.
Measure the cost of an accepted outcome
A lower token price or faster model response can coexist with a more expensive workflow. A useful operational measure is:
Cost per accepted outcome = total workflow operating cost ÷ outcomes meeting the defined acceptance criteria.
Include inference, tool calls, compute, storage, retries and human review in the numerator. Report setup and integration costs separately over a stated period. Define acceptance before testing: the correct record changed, with authorization, required evidence and no duplicate side effect. Report completion rate alongside the unit cost so the system cannot appear efficient simply by declining difficult cases.
For illustration only, a workflow costing $1,000 and producing 900 accepted outcomes costs $1.11 per outcome. A replacement costing $700 but producing only 500 accepted outcomes costs $1.40. Total spend falls 30%, yet cost per accepted outcome rises 26%. These are hypothetical figures, not results from the companies in this dataset.
Multi-step reliability needs similar care. Ten independent steps that each succeed 98% of the time yield roughly 81.7% probability that every step succeeds. Real failures may be correlated, so this is an illustration rather than a prediction. Measure complete tasks, including recovery, instead of multiplying vendor benchmark claims.
A deployment test that can challenge the claims
Test the same representative workload against the current process, a simpler automated baseline and the proposed agent system. Keep workload difficulty and acceptance criteria consistent. Include missing information, conflicting records, permission changes, a timeout after a successful write, a restart mid-task and a repeated request. Report performance on routine and difficult cases separately.
Measure accepted completion rate, cost per accepted outcome, human review time, duplicate or unauthorized changes, recovery success and the 95th-percentile completion time. A system that pauses correctly for missing authority should be distinguished from one that silently fails or proceeds without permission. Set thresholds according to the workflow's consequences, rather than importing a universal success percentage.
Anthropic’s agent-evaluation guidance discusses evaluating tasks, reading execution transcripts and combining assessment methods. This supports a practical buying principle: require evidence at the level of the workflow being purchased. A component benchmark and a successful demonstration are useful inputs, but neither establishes reliable operation across the customer's workload.
Higher valuations at the top, with a similar median
Ben West’s original study, published on 29 August 2025, used publicly collected valuations and pre/post-ChatGPT batch membership as a proxy for AI use. It found little evidence of faster valuation growth at that point, while acknowledging missing data, extraction errors, economic conditions and the possibility that effects needed more time to appear. Some figures in the original article differ from the repository’s reproduced baseline, so the two versions should not be treated as numerically interchangeable.
Portfolio composition and financial outcomes are different questions. A September 2026 re-run in the public yc-growth repository revisits an earlier valuation study using newly collected data. It is a separate dataset and method, not a valuation analysis of the 2,532-company sector snapshot above. The figures below are the re-run authors’ reported results; this article has not independently reproduced the valuation collection. Merged pull request · Re-run report.
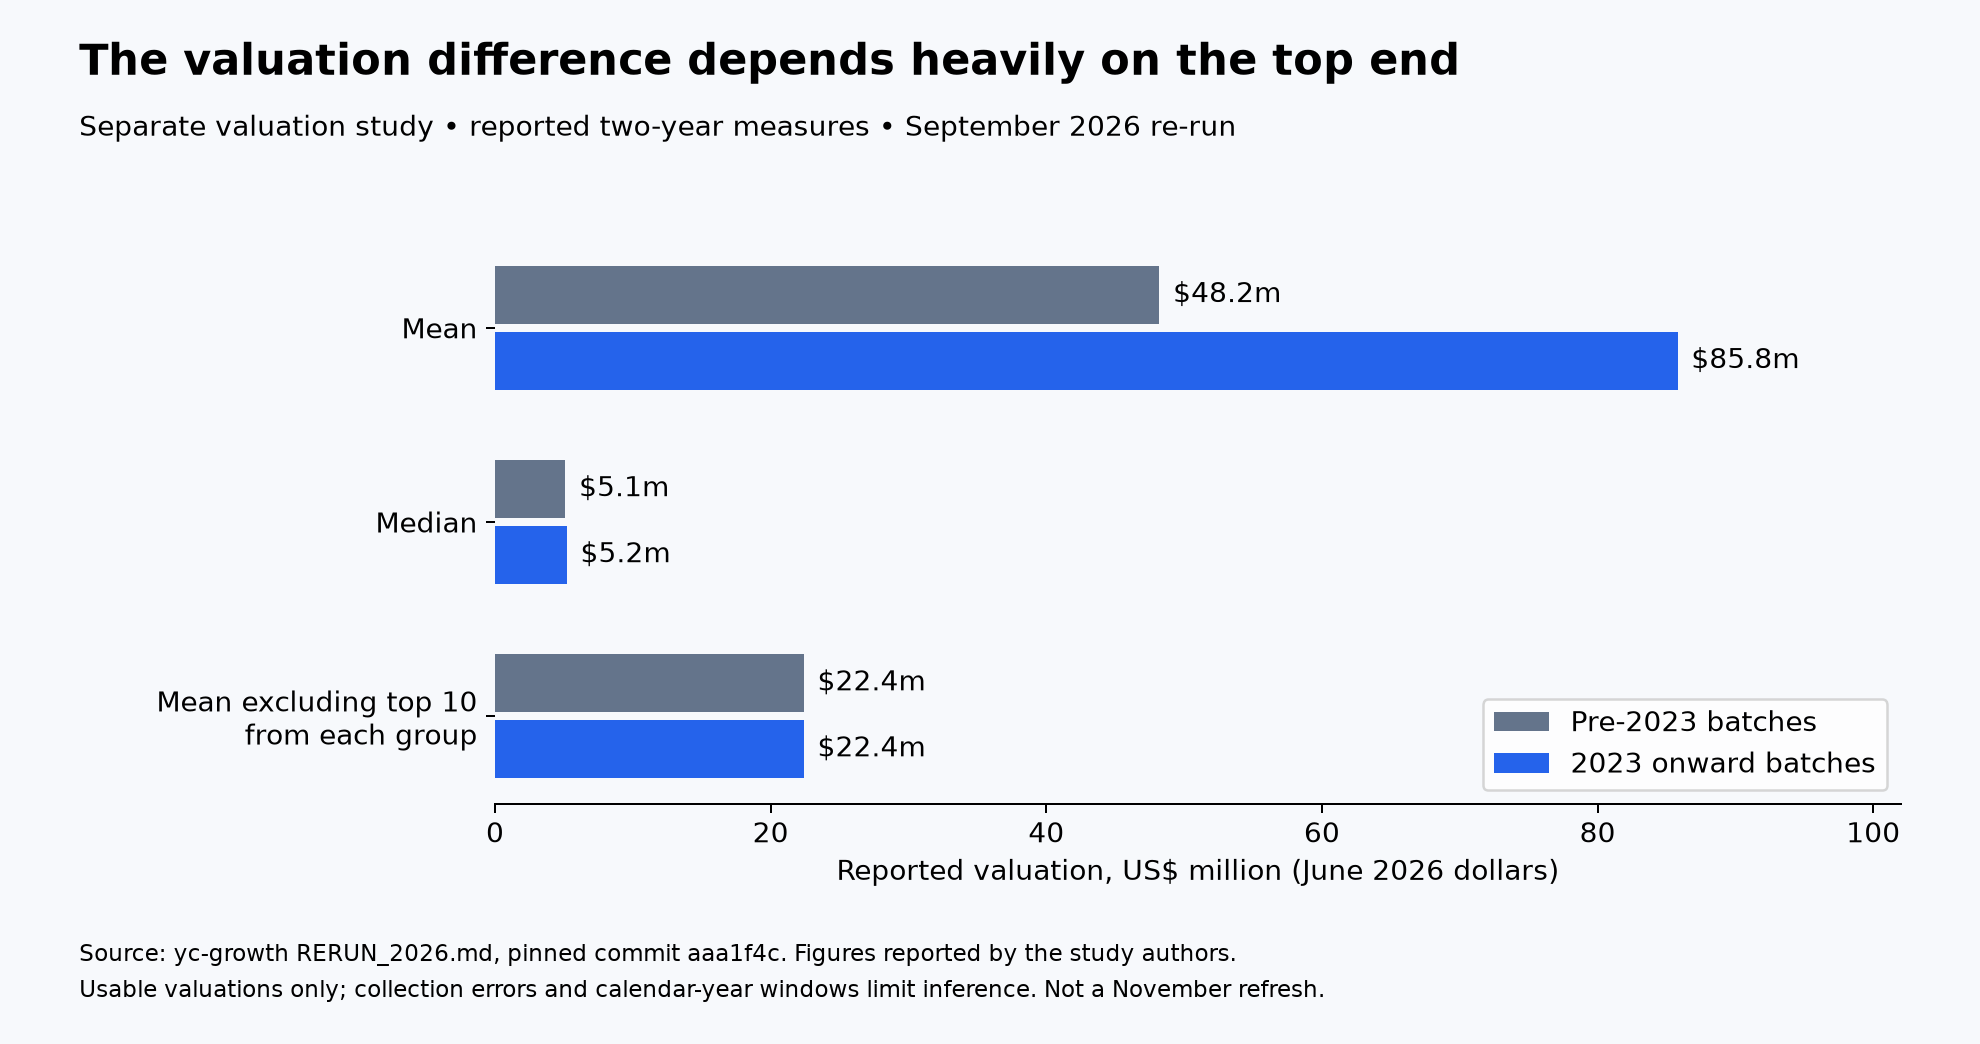
| Reported two-year valuation measure | Pre-2023 batches | 2023 onward batches |
|---|---|---|
| Mean valuation | $48.2m | $85.8m |
| Median valuation | $5.1m | $5.2m |
| Mean after removing the top 10 companies from each group | $22.4m | $22.4m |
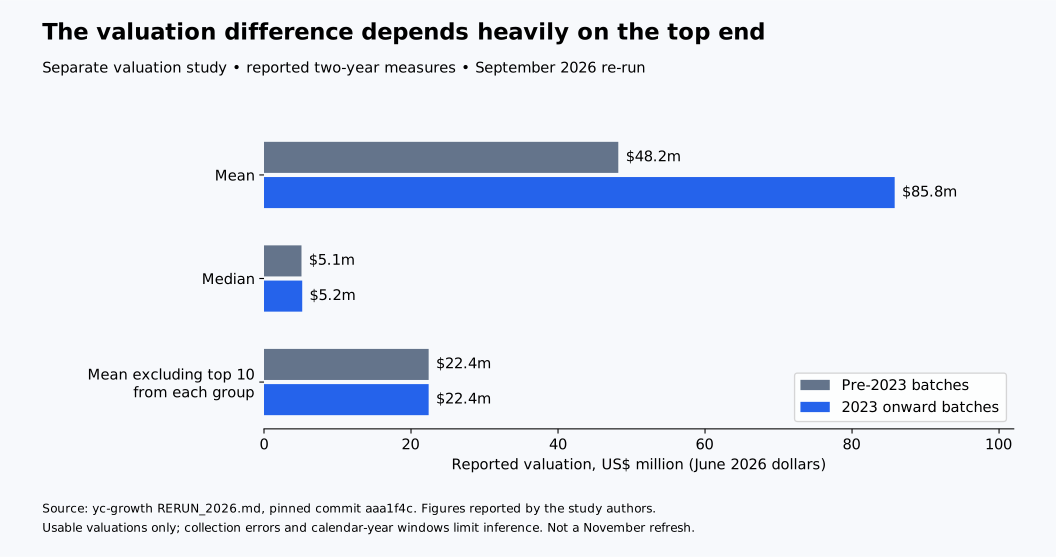
The reported mean is 1.78 times higher for recent batches, but the median differs by only $0.1 million. Removing the top 10 companies from each group leaves both means at $22.4 million. That sensitivity matters when interpreting the headline.
The re-run also reports that 10.81% of recent companies with a usable two-year valuation reached at least $100 million, compared with 4.74% of older companies in that sample. This threshold measure adds information beyond the mean: the reported difference extends beyond a single exceptional company. It remains a result for companies with available valuations, rather than a population-wide probability of success. Reported robustness checks.
The result is concentrated among highly valued companies; it does not establish a broad improvement for the typical startup. These are reported valuations, expressed in June 2026 dollars, rather than revenue, profit or realized investor returns. The comparison alone cannot identify an effect caused by generative AI.
Collection errors limit the valuation conclusions
The re-run documents substantial contamination in automated collection: invented funding rounds, confusion between companies with similar names, duplicate company entries and algorithmic valuation estimates treated as reported valuations. It also identifies an asymmetric year-selection rule that allowed a later valuation into a purported one-year result. The revised analysis filters identified problems, applies manual corrections and uses stricter target-year selection.
That is evidence of corrective work, not proof that every remaining record is accurate. The report describes manual verification of post-2023 companies appearing in the top-20 lists, rather than verification of the entire database. Most pre-2023 figures retain the older collection, while recent cohorts were re-collected with a different model. The authors’ check finds substantial disagreement between collections even for historical years. In addition, the calculation includes companies with usable numeric valuations, so its sample is not the entire YC population. Report and limitations · Cleaning and selection code.
The study’s one-year and two-year marks use calendar-year offsets from the YC batch year. This improves comparability over using today’s valuation for every company, but it is not an exact 12-month or 24-month follow-up from each company’s entry date. Companies enter batches and raise rounds at different points within a year.
The qualified finding is that the cleaned re-run reports stronger valuation results among the highest-valued recent companies, with similar medians and material data limitations. It neither establishes better survival nor resolves the separate problem of comparing closure rates across companies of different ages.
Valuation, commercial performance and survival need different evidence
A financing valuation records the price attached to a transaction. Revenue shows customer spending; profit depends on the costs of delivering that revenue. An acquisition can produce very different outcomes for founders and investors depending on its terms. None of these measures can stand in for all the others.
The same care applies to company status. Our directory snapshot contains 2,318 active, 93 acquired and 121 inactive companies. Older cohorts have had more time to develop, close or be acquired. Comparing their inactive shares directly with 2026 entrants would give newer companies an artificial advantage.
A fair closure comparison needs consistent definitions, verified event dates and equal follow-up periods, or a survival model that accounts for incomplete observation. The directory snapshot cannot provide that analysis. The valuation study’s calendar-year offsets improve age comparability for its own question, but do not supply the missing closure histories.
A November update changes one company, not the whole study
Legora announced a $550 million Series E at an $8.8 billion post-money valuation on 21 October 2026, above the $5.6 billion mark discussed in the September report. This is a concrete example of how quickly individual financing marks can change.
Our 5 November check reviewed 10 selected companies discussed in the re-run. It did not recollect the full valuation dataset or recalculate cohort statistics. The September results above retain their original collection date and inflation adjustment. Legora’s October announcement is shown as a separate nominal-dollar event.
What founders and business buyers can take from this
The B2B label covers several distinct markets. Infrastructure companies sell systems that other products depend on. Accounting, security, legal and operations companies address particular business functions. Industrial software may serve manufacturers, energy operators or defense customers without producing hardware itself.
For founders, the sector breakdown helps identify the actual market being entered: the customer, workflow and buying decision matter more than the broad AI label. A larger cohort share indicates more activity in that category; it does not establish customer demand, lower competition or better returns.
For business buyers, rising valuations are evidence of financing interest. Product decisions still require evidence of reliability, integration, operating cost and measurable results in the buyer’s own workflow.
The evidence supports a narrower conclusion: YC’s recent portfolio has a larger industrial presence, with manufacturing and robotics the largest named industrial subcategory. The separate valuation re-run reports stronger results among highly valued recent companies, while similar medians limit claims of a broad improvement. The available evidence does not identify how much of either change was caused by generative AI.
Historical announcements suggest an enterprise emphasis
YC’s historical batch announcements use different category definitions. They provide context for an enterprise emphasis, but they do not form a standardized time series.
| Batch announcement | Reported B2B/Enterprise share | Reported Fintech share |
|---|---|---|
| Winter 2022 | 34% | 24% |
| Summer 2022 | 39% | 21% |
| Summer 2023 | 70% | 10% |
Summer 2022 separately classified 13% as DevTools. That prevents a straightforward interpretation of the enterprise figures as like-for-like growth from 34% to 70%. Simply adding DevTools to one year would not demonstrate that all the remaining definitions align. These announcements suggest a stronger enterprise emphasis; they do not measure its precise size on a consistent basis or establish that ChatGPT caused it. Sources: Winter 2022, Summer 2022, Summer 2023.
The directory analysis above instead applies one snapshot’s classifications across the 2023–2026 cohorts. That makes category definitions more consistent within this analysis, while retaining the limitations of current classifications and directory coverage.
Sources and methodology
The conclusions are supported by the cited evidence within its coverage and verification limits. Directory counts describe listed companies and their current labels; company descriptions are not independent product tests. The valuation collection has not been independently verified record by record for this article.
The source for the sector analysis is YC’s public company directory, retrieved through its public directory search service on 5 November 2026. The dataset contains 2,532 unique company IDs in Winter 2023 through Fall 2026. It is a dated snapshot, not a forecast or a complete record of every company originally admitted.
Each company is counted under its first listed primary industry and, where available, its next listed subcategory. Missing subcategories remain explicitly unclassified. The B2B and Industrials breakdowns total 1,569 and 279 companies respectively. Percentages in those two tables use their respective industry totals; the cohort comparison uses all companies listed in each cohort year. Rounding can prevent percentages from adding to exactly 100%.
Current classifications are applied to every cohort. They are not archived classifications at admission. Directory additions, removals, reclassification and reporting delays can affect comparisons. YC’s historical batch announcements use their original category definitions and are presented separately from this snapshot analysis.
The valuation results are attributed to the September 2026 yc-growth re-run at the linked commit. Its collection dates, sample, inflation adjustment and year-selection rules differ from this article’s directory snapshot; the datasets have not been combined. Reported corrections have been inspected in the repository, but the underlying valuations have not all been independently verified here.
Selected company descriptions illustrate product functions, while financing announcements provide dated evidence about individual transactions. Neither establishes typical commercial outcomes, causes of success or investor returns. This article is research and general information, not investment advice or an endorsement.
Download the 2,532-company research dataset (CSV) · Download the detailed sector counts (CSV).